Difference-in-Difference (DID)
One of the most well-known estimators is probably Difference-in-Difference (DID). It compares the differences pre- and post-experiment of treatment and control. We have multiple versions of DID implemented in this framework. Where on requires a panel to be passed the other one needs a data frame (or a causal data frame to be more precise).
Causal Panel
[1]:
from azcausal.data import CaliforniaProp99
from azcausal.core.error import Bootstrap
from azcausal.core.parallelize import Pool, Joblib
from azcausal.estimators.panel.did import DID

# load an example data set with the columns Year, State, PacksPerCapita, treated.
panel = CaliforniaProp99().panel()

# initialize an estimator object, here difference in difference (did)
estimator = DID()

# run the estimator
result = estimator.fit(panel)

# plot the results
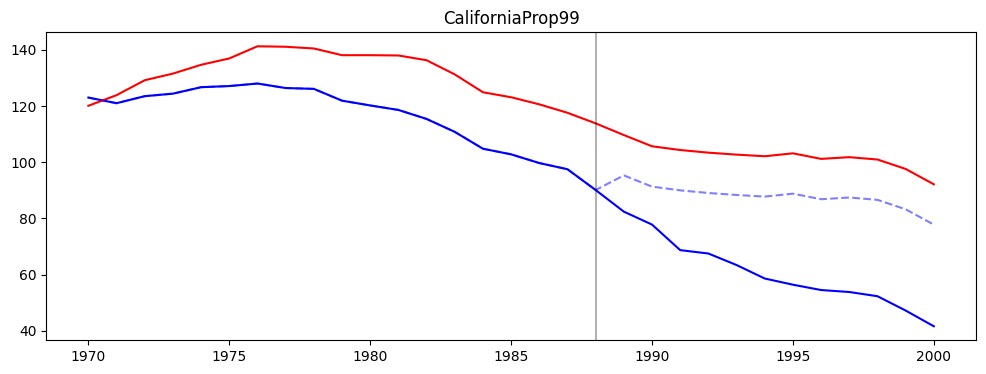
estimator.plot(result, title="CaliforniaProp99", show=False)

# create a process pool for parallelization
pool = Joblib(n_jobs=5, progress=False)

# run the error validation method
estimator.error(result, Bootstrap(n_samples=101), parallelize=pool)

# print out information about the estimate
print(result.summary(title="CaliforniaProp99"))
╭──────────────────────────────────────────────────────────────────────────────╮
|                               CaliforniaProp99                               |
├──────────────────────────────────────────────────────────────────────────────┤
|                                    Panel                                     |
|  Time Periods: 31 (19/12)                                  total (pre/post)  |
|  Units: 39 (38/1)                                       total (contr/treat)  |
├──────────────────────────────────────────────────────────────────────────────┤
|                                     ATT                                      |
|  Effect (±SE): -27.35 (±3.1080)                                              |
|  Confidence Interval (95%): [-33.44 , -21.26]                           (-)  |
|  Observed: 60.35                                                             |
|  Counter Factual: 87.70                                                      |
├──────────────────────────────────────────────────────────────────────────────┤
|                                  Percentage                                  |
|  Effect (±SE): -31.19 (±3.5439)                                              |
|  Confidence Interval (95%): [-38.13 , -24.24]                           (-)  |
|  Observed: 68.81                                                             |
|  Counter Factual: 100.00                                                     |
├──────────────────────────────────────────────────────────────────────────────┤
|                                  Cumulative                                  |
|  Effect (±SE): -328.19 (±37.30)                                              |
|  Confidence Interval (95%): [-401.29 , -255.09]                         (-)  |
|  Observed: 724.20                                                            |
|  Counter Factual: 1,052.39                                                   |
╰──────────────────────────────────────────────────────────────────────────────╯

Causal Data Frame
[2]:
from azcausal.estimators.did import DID

# load the causal data frame
cdf = CaliforniaProp99().cdf()

# initialize an estimator object, here difference in difference (did)
estimator = DID()

# fit the estimator
result = estimator.fit(cdf)

# print out information about the estimate
print(result.summary(title="CaliforniaProp99", conf=95))
╭──────────────────────────────────────────────────────────────────────────────╮
|                               CaliforniaProp99                               |
├──────────────────────────────────────────────────────────────────────────────┤
|                                    Panel                                     |
|  Time Periods: 31 (19/12)                                  total (pre/post)  |
|  Units: 39 (38/1)                                       total (contr/treat)  |
├──────────────────────────────────────────────────────────────────────────────┤
|                                     ATT                                      |
|  Effect: -27.35                                                              |
|  Observed: 60.35                                                             |
|  Counter Factual: 87.70                                                      |
├──────────────────────────────────────────────────────────────────────────────┤
|                                  Percentage                                  |
|  Effect: -31.19                                                              |
|  Observed: 68.81                                                             |
|  Counter Factual: 100.00                                                     |
├──────────────────────────────────────────────────────────────────────────────┤
|                                  Cumulative                                  |
|  Effect: -328.19                                                             |
|  Observed: 724.20                                                            |
|  Counter Factual: 1,052.39                                                   |
╰──────────────────────────────────────────────────────────────────────────────╯
Event Study
Exclude the time period -1 and set all DiD in relation to it
[3]:
from azcausal.estimators.event_study import EventStudy

# now perform the event study
estimator = EventStudy(n_pre=None, exclude=-1)

# you can fit this with a data frame or panel
result = estimator.fit(cdf)

# show the results in a plot
estimator.plot(result)

Assume that we run DID also before the experiment.
[4]:
from azcausal.estimators.event_study import EventStudy

# now perform the event study
estimator = EventStudy(n_pre=8, exclude=None)

# you can fit this with a data frame or panel
result = estimator.fit(cdf)

# show the results in a plot
estimator.plot(result)
