Statistical Power
[1]:
import matplotlib.pyplot as plt
import numpy as np
import pandas as pd
from numpy.random import RandomState

from azcausal.core.panel import CausalPanel
from azcausal.core.effect import get_true_effect
from azcausal.core.error import JackKnife
from azcausal.core.parallelize import Joblib
from azcausal.data import CaliforniaProp99
from azcausal.estimators.panel.did import DID
from azcausal.util import zeros_like
from azcausal.util.analysis import f_power
First, let us load the data you want to analyze the power on. Make sure that no units are already treated in this data set at anytime.
[2]:
panel = CaliforniaProp99().panel().filter(contr=True)

print(panel.summary())
╭──────────────────────────────────────────────────────────────────────────────╮
|                                    Panel                                     |
|  Time Periods: 31 (31/0)                                   total (pre/post)  |
|  Units: 38 (38/0)                                       total (contr/treat)  |
╰──────────────────────────────────────────────────────────────────────────────╯
Next, we define a function which will create a sample of our original panel and add some treatment.
[3]:
class Function:

    def __init__(self, panel, att, seed) -> None:
        super().__init__()
        self.panel = panel
        self.att = att
        self.seed = seed

    def __call__(self, *args, **kwargs):
        panel = self.panel

        # parameters
        seed = self.seed
        att = self.att

        # constants
        conf = 90
        n_treat = 5
        n_post = 12

        # random seed for reproducibility
        random_state = RandomState(seed)

        # define what is treated and when
        treat_units = random_state.choice(np.arange(panel.n_units()), replace=False, size=n_treat)

        intervention = zeros_like(panel.intervention)
        intervention.iloc[-n_post:, treat_units] = 1

        te = panel.outcome * intervention * (att / 100)
        outcome = panel.outcome + te

        # create the new panel with the new intervention
        panel = CausalPanel(data=dict(intervention=intervention, te=te, outcome=outcome)).setup()

        # use the estimator to get the effect
        true_effect = get_true_effect(panel)

        # run the estimator to get the predicted effect
        estimator = DID()
        result = estimator.fit(panel)
        estimator.error(result, JackKnife())
        pred_effect = result.effect

        # create an output dictionary of what is true and what we have measured
        res = dict(**pred_effect.to_dict(prefix='pred_', conf=conf), **true_effect.to_dict(prefix='true_', conf=conf))
        res.update(dict(att=att, seed=seed))

        return res
Power
Then, we create a generator which creates the runs. For each iteration we initialize the Function, we have defined above.
[4]:
# the number of samples used for measuring power
n_samples = 100

# create all runs for this analysis (this can potentially include more dimensions as well)
def g_power():
    for seed in range(n_samples):
        yield panel, -20, seed
Because running this sequentially is usually pretty slow, we make use of the Parallelize interface in azcausal to speed things up.
[5]:
parallelize = Joblib(prefer='processes', progress=True)
results = parallelize.run([Function(*args) for args in g_power()])

len(results)
100%|██████████| 100/100 [00:04<00:00, 21.04it/s]
[5]:
100
And then we can analyze the resulting power and also coverage of the confidence intervals.
[6]:
dx = (pd.DataFrame(results)
      .assign(true_in_ci=lambda dd: dd['true_avg_te'].between(dd['pred_avg_ci_lb'], dd['pred_avg_ci_ub']))
      .assign(avg_te_error=lambda dd: dd['true_avg_te'] - dd['pred_avg_te'])
      .assign(rel_te_error=lambda dd: dd['true_rel_te'] - dd['pred_rel_te'])
      )

# get the power from the results
power = f_power(dx.assign(sign=lambda dd: dd['pred_sign']))

print("Power")
print(f"(+) {power['+']:.2%}")
print(f"(+/-) {power['+/-']:.2%}")
print(f"(-) {power['-']:.2%}")

print()

coverage = dx['true_in_ci'].mean()
print(f"Coverage: {coverage:.1%}")

avg_te_rmse = np.sqrt((dx['avg_te_error'] ** 2).mean())
print(f"Average TE RMSE: {avg_te_rmse}")

rel_te_rmse = np.sqrt((dx['rel_te_error'] ** 2).mean())
print(f"Relative TE RMSE: {rel_te_rmse}")
Power
(+) 0.00%
(+/-) 5.00%
(-) 95.00%

Coverage: 89.0%
Average TE RMSE: 7.986427459857413
Relative TE RMSE: 0.05869881281193749
Power Analysis
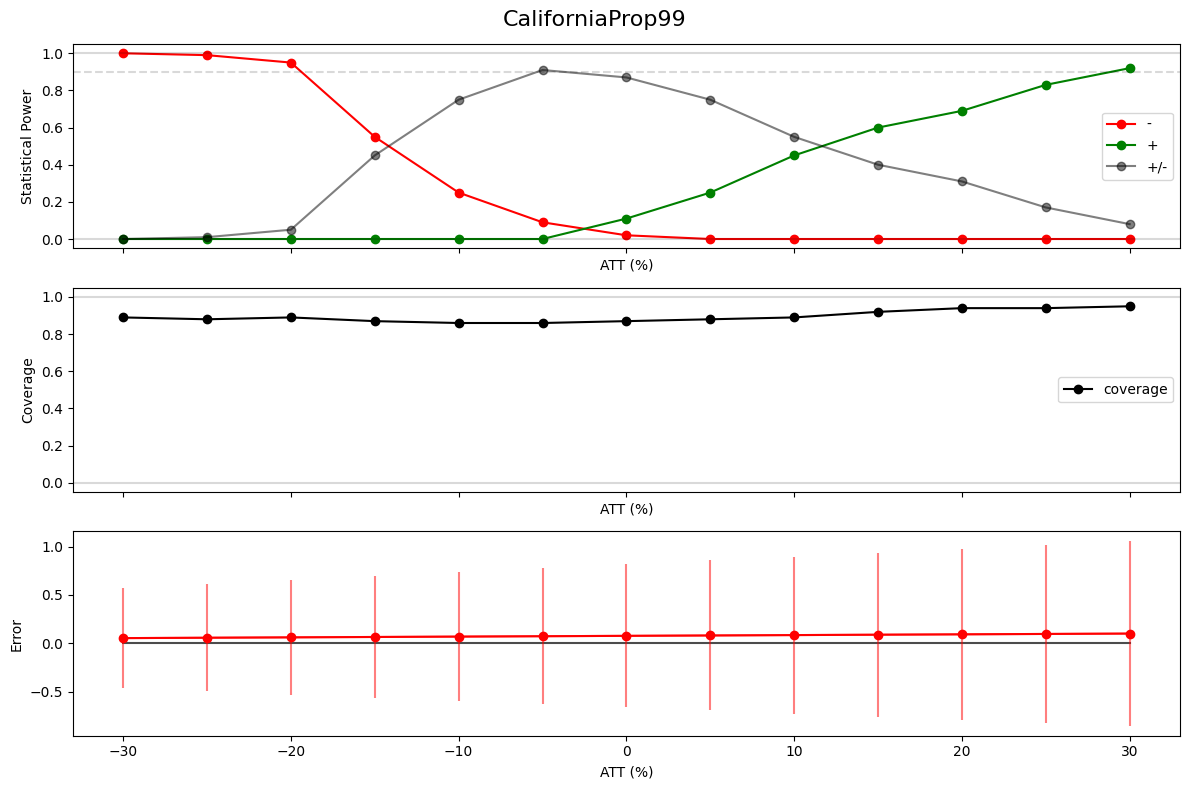
We estimate our statistical power to be around 95% given the setup above. In addition, we might want to be a little more systematic and answer the question of how much power does a specific ATT parameter have (this can be extended to any parameter such as number of treatment regions or post time periods).
[7]:
def g_power_analysis():
    for att in np.linspace(-30, 30, 13):
        for seed in range(n_samples):
            yield att, seed


parallelize = Joblib(prefer='processes', progress=True)
results = parallelize.run([Function(panel, *args) for args in g_power_analysis()])
100%|██████████| 1300/1300 [00:45<00:00, 28.35it/s]
[8]:
dx.columns
[8]:
Index(['pred_effect', 'pred_sign', 'pred_avg_te', 'pred_avg_ci_lb',
       'pred_avg_ci_ub', 'pred_rel_te', 'pred_rel_ci_lb', 'pred_rel_ci_ub',
       'pred_perc_te', 'pred_perc_ci_lb', 'pred_perc_ci_ub', 'pred_cum_te',
       'pred_cum_ci_lb', 'pred_cum_ci_ub', 'true_effect', 'true_sign',
       'true_avg_te', 'true_avg_ci_lb', 'true_avg_ci_ub', 'true_rel_te',
       'true_rel_ci_lb', 'true_rel_ci_ub', 'true_perc_te', 'true_perc_ci_lb',
       'true_perc_ci_ub', 'true_cum_te', 'true_cum_ci_lb', 'true_cum_ci_ub',
       'att', 'seed', 'true_in_ci', 'avg_te_error', 'rel_te_error'],
      dtype='object')
[9]:
dx = (pd.DataFrame(results)
      .assign(true_in_ci=lambda dd: dd['true_avg_te'].between(dd['pred_avg_ci_lb'], dd['pred_avg_ci_ub']))
      .assign(perc_te_error=lambda dd: dd['pred_perc_te'] - dd['true_perc_te'])
      )

# get the power and coverage for each group now
pw = dx.assign(sign=lambda dd: dd['pred_sign']).groupby('att').apply(f_power).sort_index().reset_index()
coverage = dx.groupby('att')['true_in_ci'].mean()
error = dx.groupby('att').aggregate(mean=('perc_te_error', 'mean'), se=('perc_te_error', 'sem'))
[10]:
fig, (top, middle, bottom) = plt.subplots(3, 1, figsize=(12, 8), sharex=True)

fig.suptitle(f'CaliforniaProp99', fontsize=16)

top.plot(pw['att'], pw['-'], "-o", color="red", label='-')
top.plot(pw['att'], pw['+'], "-o", color="green", label='+')
top.plot(pw['att'], pw['+/-'], "-o", color="black", label='+/-', alpha=0.5)
top.axhline(1.0, color="black", alpha=0.15)
top.axhline(0.9, color="black", alpha=0.15, linestyle='--')
top.axhline(0.0, color="black", alpha=0.15)
top.set_ylim(-0.05, 1.05)
top.set_xlabel("ATT (%)")
top.set_ylabel("Statistical Power")
top.legend()

middle.plot(coverage.index, coverage.values, "-o", color="black", label="coverage")
middle.axhline(1.0, color="black", alpha=0.15)
middle.axhline(0.0, color="black", alpha=0.15)
middle.set_ylim(-0.05, 1.05)
middle.set_xlabel("ATT (%)")
middle.set_ylabel("Coverage")
middle.legend()


bottom.plot(error.index, np.zeros(len(error)), color='black', alpha=0.7)
bottom.plot(error.index, error['mean'], '-o', color='red')
bottom.errorbar(error.index, error['mean'], error['se'], color='red', alpha=0.5, barsabove=True)
bottom.set_xlabel("ATT (%)")
bottom.set_ylabel("Error")

plt.tight_layout()
plt.show()
