Getting Started
This guide covers the steps to get started with azcausal. We have split this introduction into several parts:
Part I : The Panel
Part II: The Treatment Effect
Part III: Analysis & Visualization
Part I: Causal Panel
The very first step before doing any causal inference is get loading the data and tranforming them in the right format. Most estimators in this framework require the data to be in form of a Panel object.
Assuming we have the following data frame representing the CaliforniaProp99 information:
[1]:
from azcausal.data import CaliforniaProp99

df = CaliforniaProp99().df()

df
[1]:
| State | Year | PacksPerCapita | treated | |
|---|---|---|---|---|
| 0 | Alabama | 1970 | 89.800003 | 0 |
| 1 | Arkansas | 1970 | 100.300003 | 0 |
| 2 | Colorado | 1970 | 124.800003 | 0 |
| 3 | Connecticut | 1970 | 120.000000 | 0 |
| 4 | Delaware | 1970 | 155.000000 | 0 |
| ... | ... | ... | ... | ... |
| 1204 | Virginia | 2000 | 96.699997 | 0 |
| 1205 | West Virginia | 2000 | 107.900002 | 0 |
| 1206 | Wisconsin | 2000 | 80.099998 | 0 |
| 1207 | Wyoming | 2000 | 90.500000 | 0 |
| 1208 | California | 2000 | 41.599998 | 1 |
1209 rows × 4 columns
In this example, the columns represent the following:
The units: are given by each state (
State)The time: is represented in years (
Year)The outcome is the number of packs sold (
PacksPerCapita)The intervention is indicated by the binary treatment column (
treated)
We define a Panel as a data frame where the index represents time and each column a unit. We can extract the outcome from the data frame by:
[2]:
from azcausal.util import to_panel

outcome = to_panel(df, "Year", "State", "PacksPerCapita")

outcome.head(3)
[2]:
| State | Alabama | Arkansas | California | Colorado | Connecticut | Delaware | Georgia | Idaho | Illinois | Indiana | ... | South Carolina | South Dakota | Tennessee | Texas | Utah | Vermont | Virginia | West Virginia | Wisconsin | Wyoming |
|---|---|---|---|---|---|---|---|---|---|---|---|---|---|---|---|---|---|---|---|---|---|
| Year | |||||||||||||||||||||
| 1970 | 89.800003 | 100.300003 | 123.0 | 124.800003 | 120.000000 | 155.000000 | 109.900002 | 102.400002 | 124.800003 | 134.600006 | ... | 103.599998 | 92.699997 | 99.800003 | 106.400002 | 65.500000 | 122.599998 | 124.300003 | 114.5 | 106.400002 | 132.199997 |
| 1971 | 95.400002 | 104.099998 | 121.0 | 125.500000 | 117.599998 | 161.100006 | 115.699997 | 108.500000 | 125.599998 | 139.300003 | ... | 115.000000 | 96.699997 | 106.300003 | 108.900002 | 67.699997 | 124.400002 | 128.399994 | 111.5 | 105.400002 | 131.699997 |
| 1972 | 101.099998 | 103.900002 | 123.5 | 134.300003 | 110.800003 | 156.300003 | 117.000000 | 126.099998 | 126.599998 | 149.199997 | ... | 118.699997 | 103.000000 | 111.500000 | 108.599998 | 71.300003 | 138.000000 | 137.000000 | 117.5 | 108.800003 | 140.000000 |
3 rows × 39 columns
To check whether the panel data are in fact balanced (we have an entry during each time step for each unit), we can check for NaN values in the data frame:
[3]:
print("Is Balanced:", (~outcome.isna()).all(axis=None))
Is Balanced: True
Let us simulated some data would be missing
[4]:
not_balanced = to_panel(df.head(80), "Year", "State", "PacksPerCapita")
print("Is Balanced:", (~not_balanced.isna()).all(axis=None))

not_balanced.head(3)
Is Balanced: False
[4]:
| State | Alabama | Arkansas | California | Colorado | Connecticut | Delaware | Georgia | Idaho | Illinois | Indiana | ... | South Carolina | South Dakota | Tennessee | Texas | Utah | Vermont | Virginia | West Virginia | Wisconsin | Wyoming |
|---|---|---|---|---|---|---|---|---|---|---|---|---|---|---|---|---|---|---|---|---|---|
| Year | |||||||||||||||||||||
| 1970 | 89.800003 | 100.300003 | 123.0 | 124.800003 | 120.000000 | 155.000000 | 109.900002 | 102.400002 | 124.800003 | 134.600006 | ... | 103.599998 | 92.699997 | 99.800003 | 106.400002 | 65.500000 | 122.599998 | 124.300003 | 114.5 | 106.400002 | 132.199997 |
| 1971 | 95.400002 | 104.099998 | 121.0 | 125.500000 | 117.599998 | 161.100006 | 115.699997 | 108.500000 | 125.599998 | 139.300003 | ... | 115.000000 | 96.699997 | 106.300003 | 108.900002 | 67.699997 | 124.400002 | 128.399994 | 111.5 | 105.400002 | 131.699997 |
| 1972 | 101.099998 | 103.900002 | NaN | NaN | NaN | NaN | NaN | NaN | NaN | NaN | ... | NaN | NaN | NaN | NaN | NaN | NaN | NaN | NaN | NaN | NaN |
3 rows × 39 columns
Instead of extacting only one value at a time, we can also extract multiple directly by
[5]:
from azcausal.util import to_panels

data = to_panels(df, "Year", "State", ["PacksPerCapita", "treated"])

data.keys()
[5]:
dict_keys(['PacksPerCapita', 'treated'])
The reason why we have introduced an object called Panel is to combine multiple data frames into one and to have convinient access to information about the time pre and post experiment, as well as control and treatment units. A Panel can be created by passing the outcome and intervention directly as pd.DataFrame:
[6]:
from azcausal.core.panel import CausalPanel

panel = CausalPanel(data=data).setup(outcome='PacksPerCapita', intervention='treated')

print(panel.summary())
╭──────────────────────────────────────────────────────────────────────────────╮
|                                    Panel                                     |
|  Time Periods: 31 (19/12)                                  total (pre/post)  |
|  Units: 39 (38/1)                                       total (contr/treat)  |
╰──────────────────────────────────────────────────────────────────────────────╯
The panel allows accessing outcome and intervention directly trough properties:
[7]:
panel.outcome.head(3)
[7]:
| State | Alabama | Arkansas | California | Colorado | Connecticut | Delaware | Georgia | Idaho | Illinois | Indiana | ... | South Carolina | South Dakota | Tennessee | Texas | Utah | Vermont | Virginia | West Virginia | Wisconsin | Wyoming |
|---|---|---|---|---|---|---|---|---|---|---|---|---|---|---|---|---|---|---|---|---|---|
| Year | |||||||||||||||||||||
| 1970 | 89.800003 | 100.300003 | 123.0 | 124.800003 | 120.000000 | 155.000000 | 109.900002 | 102.400002 | 124.800003 | 134.600006 | ... | 103.599998 | 92.699997 | 99.800003 | 106.400002 | 65.500000 | 122.599998 | 124.300003 | 114.5 | 106.400002 | 132.199997 |
| 1971 | 95.400002 | 104.099998 | 121.0 | 125.500000 | 117.599998 | 161.100006 | 115.699997 | 108.500000 | 125.599998 | 139.300003 | ... | 115.000000 | 96.699997 | 106.300003 | 108.900002 | 67.699997 | 124.400002 | 128.399994 | 111.5 | 105.400002 | 131.699997 |
| 1972 | 101.099998 | 103.900002 | 123.5 | 134.300003 | 110.800003 | 156.300003 | 117.000000 | 126.099998 | 126.599998 | 149.199997 | ... | 118.699997 | 103.000000 | 111.500000 | 108.599998 | 71.300003 | 138.000000 | 137.000000 | 117.5 | 108.800003 | 140.000000 |
3 rows × 39 columns
or using the index function by
[8]:
panel['outcome'].head(3)
[8]:
| State | Alabama | Arkansas | California | Colorado | Connecticut | Delaware | Georgia | Idaho | Illinois | Indiana | ... | South Carolina | South Dakota | Tennessee | Texas | Utah | Vermont | Virginia | West Virginia | Wisconsin | Wyoming |
|---|---|---|---|---|---|---|---|---|---|---|---|---|---|---|---|---|---|---|---|---|---|
| Year | |||||||||||||||||||||
| 1970 | 89.800003 | 100.300003 | 123.0 | 124.800003 | 120.000000 | 155.000000 | 109.900002 | 102.400002 | 124.800003 | 134.600006 | ... | 103.599998 | 92.699997 | 99.800003 | 106.400002 | 65.500000 | 122.599998 | 124.300003 | 114.5 | 106.400002 | 132.199997 |
| 1971 | 95.400002 | 104.099998 | 121.0 | 125.500000 | 117.599998 | 161.100006 | 115.699997 | 108.500000 | 125.599998 | 139.300003 | ... | 115.000000 | 96.699997 | 106.300003 | 108.900002 | 67.699997 | 124.400002 | 128.399994 | 111.5 | 105.400002 | 131.699997 |
| 1972 | 101.099998 | 103.900002 | 123.5 | 134.300003 | 110.800003 | 156.300003 | 117.000000 | 126.099998 | 126.599998 | 149.199997 | ... | 118.699997 | 103.000000 | 111.500000 | 108.599998 | 71.300003 | 138.000000 | 137.000000 | 117.5 | 108.800003 | 140.000000 |
3 rows × 39 columns
[9]:
panel.intervention.tail(3)
[9]:
| State | Alabama | Arkansas | California | Colorado | Connecticut | Delaware | Georgia | Idaho | Illinois | Indiana | ... | South Carolina | South Dakota | Tennessee | Texas | Utah | Vermont | Virginia | West Virginia | Wisconsin | Wyoming |
|---|---|---|---|---|---|---|---|---|---|---|---|---|---|---|---|---|---|---|---|---|---|
| Year | |||||||||||||||||||||
| 1998 | 0 | 0 | 1 | 0 | 0 | 0 | 0 | 0 | 0 | 0 | ... | 0 | 0 | 0 | 0 | 0 | 0 | 0 | 0 | 0 | 0 |
| 1999 | 0 | 0 | 1 | 0 | 0 | 0 | 0 | 0 | 0 | 0 | ... | 0 | 0 | 0 | 0 | 0 | 0 | 0 | 0 | 0 | 0 |
| 2000 | 0 | 0 | 1 | 0 | 0 | 0 | 0 | 0 | 0 | 0 | ... | 0 | 0 | 0 | 0 | 0 | 0 | 0 | 0 | 0 | 0 |
3 rows × 39 columns
Moreover, the method also allows to use the most common pandas functions on ALL DATA at once:
[10]:
new_panel = panel.iloc[:, :3]

new_panel.outcome.head(3)
[10]:
| State | Alabama | Arkansas | California |
|---|---|---|---|
| Year | |||
| 1970 | 89.800003 | 100.300003 | 123.0 |
| 1971 | 95.400002 | 104.099998 | 121.0 |
| 1972 | 101.099998 | 103.900002 | 123.5 |
Also, we can use the get method with key word arguments.
if
contr == Truethen only control units are returned.if
treat == Truethen units which have been treated at least once are returned.if
pre == Truethen time steps where no unit is treated is returned.if
post == Truethen the time steps where at least one unit is treated.
, for example:
[11]:
panel.filter(target='outcome', post=True, treat=True).head(3)
[11]:
| State | California |
|---|---|
| Year | |
| 1989 | 82.400002 |
| 1990 | 77.800003 |
| 1991 | 68.699997 |
For more methods please check the Panel immplementation directly.
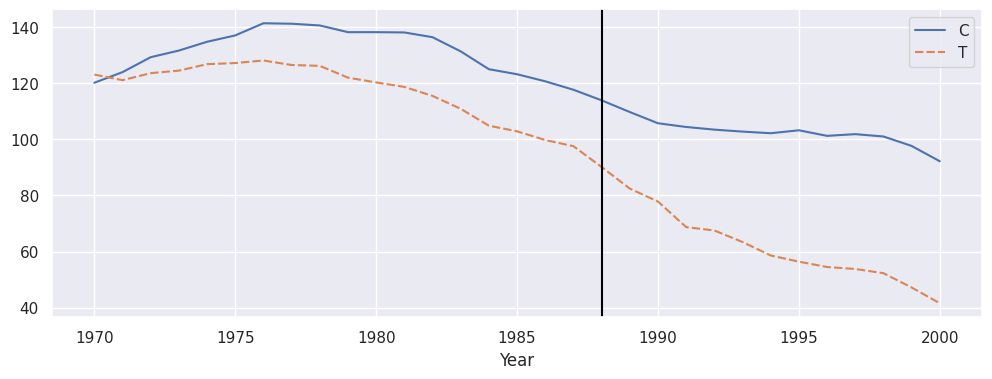
Using the CausalPanel it is also relatively easy to plot the average control versus treatment by:
[12]:
import seaborn as sns
sns.set(rc={'figure.figsize':(12,4)})

import matplotlib.pyplot as plt

avg_control = panel.filter(target='outcome', contr=True).mean(axis=1).to_frame('C')
avg_treat = panel.filter(target='outcome', treat=True).mean(axis=1).to_frame('T')

plt.subplots(1, 1, figsize=(12, 4))
sns.lineplot(avg_control.join(avg_treat))
plt.axvline(panel.filter(target="intervention", pre=True).index.max(), color='black', label='intervention')
[12]:
<matplotlib.lines.Line2D at 0x7fd4bda4c4c0>

Part II: The Treatment Effect
After bringing the data into the right format, we can use an Estimator to make predictions of the treatment effect.
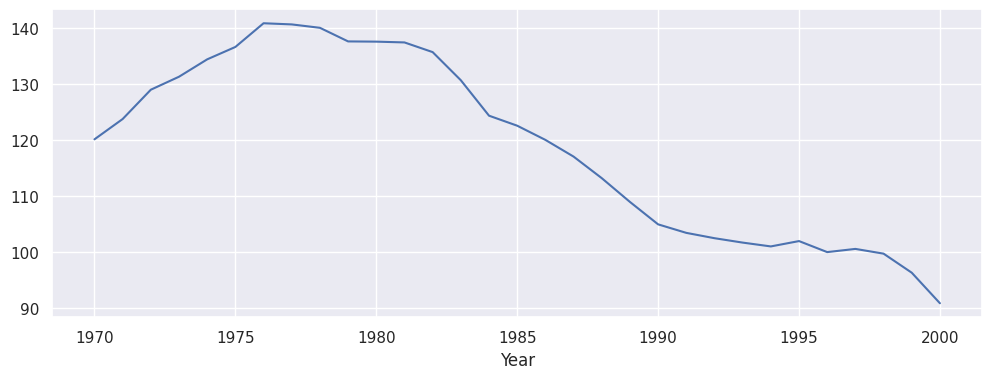
Like commonly done for time series it is always a good idea to quickly spot check the time series:
[13]:
print(panel.summary())

panel.outcome.mean(axis=1).plot(figsize=(12, 4))
╭──────────────────────────────────────────────────────────────────────────────╮
|                                    Panel                                     |
|  Time Periods: 31 (19/12)                                  total (pre/post)  |
|  Units: 39 (38/1)                                       total (contr/treat)  |
╰──────────────────────────────────────────────────────────────────────────────╯
[13]:
<Axes: xlabel='Year'>

For example, let us use the popular DID estimator to estimate the Average Treatment Effect on the Treated (ATT) for the panel data.
[14]:
from azcausal.estimators.panel.did import DID

# initialize an estimator object
estimator = DID()

# estimate the treatment effect
result = estimator.fit(panel)

# print the treatment effect summary
print(result.summary(percentage=True, cumulative=True))
╭──────────────────────────────────────────────────────────────────────────────╮
|                                    Panel                                     |
|  Time Periods: 31 (19/12)                                  total (pre/post)  |
|  Units: 39 (38/1)                                       total (contr/treat)  |
├──────────────────────────────────────────────────────────────────────────────┤
|                                     ATT                                      |
|  Effect: -27.35                                                              |
|  Observed: 60.35                                                             |
|  Counter Factual: 87.70                                                      |
├──────────────────────────────────────────────────────────────────────────────┤
|                                  Percentage                                  |
|  Effect: -31.19                                                              |
|  Observed: 68.81                                                             |
|  Counter Factual: 100.00                                                     |
├──────────────────────────────────────────────────────────────────────────────┤
|                                  Cumulative                                  |
|  Effect: -328.19                                                             |
|  Observed: 724.20                                                            |
|  Counter Factual: 1,052.39                                                   |
╰──────────────────────────────────────────────────────────────────────────────╯
Now, the treatment effect without any confidence intervals is often not that helpful. Some estimators come with error estimates out of the box and will directly provide them (e.g. DIDRegression). For others, we can use an Error estimator to attach an error and calculate confidence intervals along with it.
The following error estimators are available:
Bootstrap: Randomly sample units (with replacement) from the panel data and estimate the effect.
Placebo: Only sample from control units as use them as placebo.
JackKnife: Leave one out crossvalidation but removing one unit at a time.
Each error estimate requires a treatment estimated on a new panel derived from the original data set by the corresponding method.
Each estimator has a method called estimator.error(result, method) which takes the original Result object returned before and the Error estimation method that should be used.
[15]:
from azcausal.core.error import Bootstrap

se, runs = estimator.error(result, Bootstrap(n_samples=500))

print(result.summary(conf=90))
╭──────────────────────────────────────────────────────────────────────────────╮
|                                    Panel                                     |
|  Time Periods: 31 (19/12)                                  total (pre/post)  |
|  Units: 39 (38/1)                                       total (contr/treat)  |
├──────────────────────────────────────────────────────────────────────────────┤
|                                     ATT                                      |
|  Effect (±SE): -27.35 (±2.7923)                                              |
|  Confidence Interval (90%): [-31.94 , -22.76]                           (-)  |
|  Observed: 60.35                                                             |
|  Counter Factual: 87.70                                                      |
├──────────────────────────────────────────────────────────────────────────────┤
|                                  Percentage                                  |
|  Effect (±SE): -31.19 (±3.1839)                                              |
|  Confidence Interval (90%): [-36.42 , -25.95]                           (-)  |
|  Observed: 68.81                                                             |
|  Counter Factual: 100.00                                                     |
├──────────────────────────────────────────────────────────────────────────────┤
|                                  Cumulative                                  |
|  Effect (±SE): -328.19 (±33.51)                                              |
|  Confidence Interval (90%): [-383.30 , -273.07]                         (-)  |
|  Observed: 724.20                                                            |
|  Counter Factual: 1,052.39                                                   |
╰──────────────────────────────────────────────────────────────────────────────╯
Similarly, we can use SDID as an estimator
[16]:
from azcausal.estimators.panel.sdid import SDID
from azcausal.core.error import JackKnife

# initialize an estimator object
estimator = SDID()

# estimate the treatment effect
result = estimator.fit(panel)

# here we use JackKnife which is optmized to be run with SDID
estimator.error(result, JackKnife())

# print the treatment effect summary
print(result.summary(percentage=True, cumulative=True))
╭──────────────────────────────────────────────────────────────────────────────╮
|                                    Panel                                     |
|  Time Periods: 31 (19/12)                                  total (pre/post)  |
|  Units: 39 (38/1)                                       total (contr/treat)  |
├──────────────────────────────────────────────────────────────────────────────┤
|                                     ATT                                      |
|  Effect (±SE): -15.60 (±2.9161)                                              |
|  Confidence Interval (95%): [-21.32 , -9.8884]                          (-)  |
|  Observed: 60.35                                                             |
|  Counter Factual: 75.95                                                      |
├──────────────────────────────────────────────────────────────────────────────┤
|                                  Percentage                                  |
|  Effect (±SE): -20.54 (±3.8393)                                              |
|  Confidence Interval (95%): [-28.07 , -13.02]                           (-)  |
|  Observed: 79.46                                                             |
|  Counter Factual: 100.00                                                     |
├──────────────────────────────────────────────────────────────────────────────┤
|                                  Cumulative                                  |
|  Effect (±SE): -187.25 (±34.99)                                              |
|  Confidence Interval (95%): [-255.83 , -118.66]                         (-)  |
|  Observed: 724.20                                                            |
|  Counter Factual: 911.45                                                     |
╰──────────────────────────────────────────────────────────────────────────────╯
Part III: Analysis & Visualization
Lastly, we want to give some idea on how to visualize results.
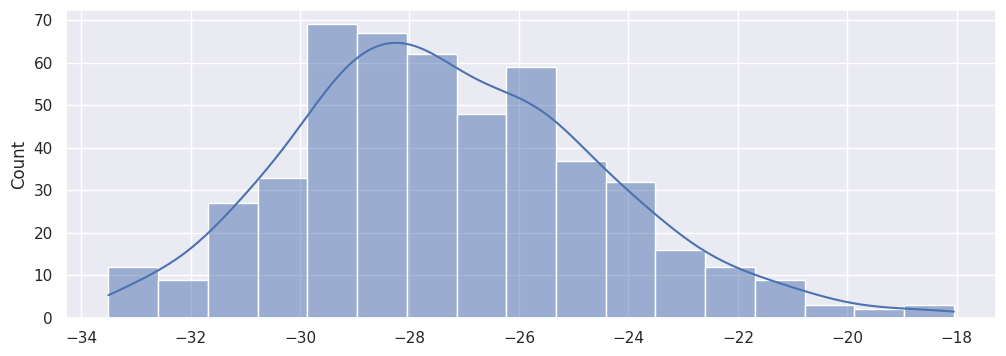
To learn more about how the error estimation was originally derived, we can check the corresponding distribution by plotting the estimates of each of the runs:
[17]:
vv = [run.effect.value for run in runs]
sns.histplot(vv, kde=True)
[17]:
<Axes: ylabel='Count'>

Each post-analysis will be different depending on the estimator. We would like a give an example of SDID here. The available additional information stored by the estimator are:
[18]:
effect = result.effect

effect.data.keys()
[18]:
dict_keys(['did', 'lambd', 'omega', 'solvers', 'error'])
The DID results give us additional information about how the ATT is actually calculated:
[19]:
effect['did']
[19]:
{'att': -15.603827872733866,
 'delta_contr': -19.192040932672626,
 'delta_treat': -34.79586880540649,
 'pre_contr': 120.49828909527162,
 'post_contr': 101.30624816259899,
 'pre_treat': 95.14586886957316,
 'post_treat': 60.35000006416667}
The unit weights (omega) with at least 1% contribution
[20]:
effect['omega'].sort_values(ascending=False).loc[lambda x: x >= 0.01]
[20]:
Nevada            0.124489
New Hampshire     0.105048
Connecticut       0.078287
Delaware          0.070368
Colorado          0.057513
Illinois          0.053388
Nebraska          0.047853
Montana           0.045135
Utah              0.041518
New Mexico        0.040568
Minnesota         0.039495
Wisconsin         0.036667
West Virginia     0.033569
North Carolina    0.032805
Idaho             0.031468
Ohio              0.031461
Maine             0.028211
Iowa              0.025939
Kansas            0.021605
Pennsylvania      0.015352
Indiana           0.010135
Name: omega, dtype: float64
Similarly, the time weights
[21]:
effect['lambd'].sort_values(ascending=False).loc[lambda x: x >= 0.01]
[21]:
1988    0.427076
1986    0.366471
1987    0.206453
Name: lambd, dtype: float64
Or in general the treatment effect over time:
[22]:
# Control (C), Treatment (T), Time Weights (lambd), Intervention (W), Average Treatment Effect on the Treated (att), Counter Factual (CF)
effect.by_time.tail(5)
[22]:
| C | T | post | att | CF | |
|---|---|---|---|---|---|
| Year | |||||
| 1996 | 99.202557 | 54.500000 | True | -19.350137 | 73.850137 |
| 1997 | 100.035935 | 53.799999 | True | -20.883516 | 74.683515 |
| 1998 | 100.433993 | 52.299999 | True | -22.781573 | 75.081573 |
| 1999 | 98.497346 | 47.200001 | True | -25.944925 | 73.144926 |
| 2000 | 91.437300 | 41.599998 | True | -24.484882 | 66.084880 |
[23]:
effect.by_time[['C', 'CF', 'T']].head(3)
[23]:
| C | CF | T | |
|---|---|---|---|
| Year | |||
| 1970 | 141.885954 | 123.0 | 123.0 |
| 1971 | 145.202800 | 121.0 | 121.0 |
| 1972 | 149.827472 | 123.5 | 123.5 |
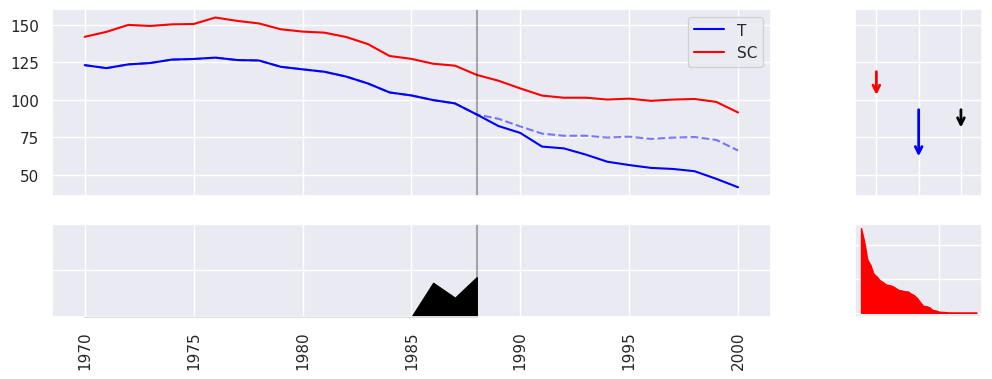
Some estimators will have directly a plotting method for the result:
[24]:
estimator.plot(result, show=False, CF=True)
None
